
Data Visualization Tools Market Overview:
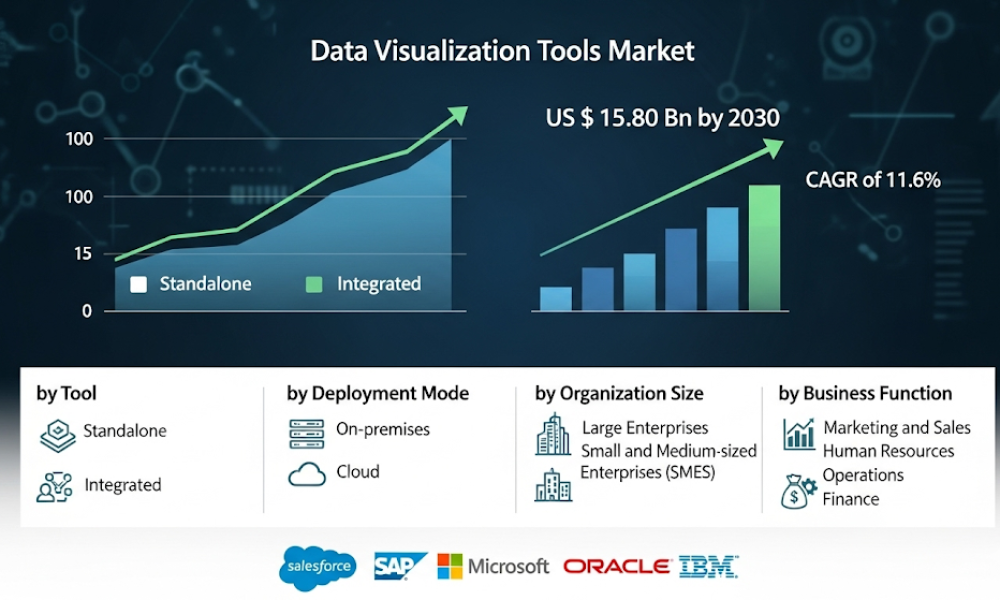
Data Visualization Tools Market was valued at approximately USD 7.33 billion in 2023 and is projected to reach around USD 15.80 billion by 2030, growing at a compound annual growth rate (CAGR) of about 11.6%. This rapid growth is driven by the exponential increase in data generated across industries, the need for insightful analytics, and the expanding adoption of advanced BI platforms.
Key Highlights / Key Insights
- Market Size & Growth: The global data visualization tools market is valued at USD 7.33 billion in 2024 and is projected to reach over USD 15.80 billion by 2030, growing at a CAGR of approximately 11.6%.
- Dominating Region: North America remains the largest regional market, responsible for roughly 33% of global revenue. This leadership is fueled by high digital transformation, significant investment in analytics solutions, and broad adoption across both enterprise and SMB segments.
- Leading Segment: The banking, financial services, and insurance (BFSI) sector, together with IT and telecom, represent the largest user groups, leveraging visualization platforms for fraud detection, risk assessment, and customer analytics—BFSI alone accounts for over 23% of global uptake.
- Key Driver: Exponential growth of big data across all industries, combined with demand for real-time and predictive analytics, is rapidly accelerating enterprise adoption of advanced visualization platforms, transforming raw information into actionable business insights.
Recent Developments
- 2025: Microsoft, Tableau (Salesforce), and IBM launched augmented analytics features, leveraging AI to automate visual insights in business dashboards for US and European clients.
- Ongoing: Major vendors, including SAP and Oracle, have rolled out cloud-native visualization suites with enhanced mobile capabilities and native integration with business intelligence tools.
- 2024: Asian markets saw a surge in local SaaS visualization startups, driving rapid innovation and adoption in manufacturing and e-commerce analytics.
Market Dynamics
- Growth Catalysts: Ballooning data volumes, proliferation of IoT devices, and the convergence of data science and business intelligence are prompting organizations to invest in flexible, scalable visualization solutions.
- Challenges: Persistent concerns remain about data security, privacy, and the skills gap required for effective deployment and interpretation of advanced visualization technology.
- Opportunities: Sector-specific visualization tools for healthcare, retail, and logistics; democratization of analytics through self-service platforms; and cloud migration driving efficiency and scalability.
Intrigued to explore the contents? Secure your hands-on sample copy of the report: https://www.maximizemarketresearch.com/request-sample/102177/
Regional Analysis
- North America: Largest market, with robust investments in cloud deployments, AI integration, and data infrastructure across banking, healthcare, retail, and government.
- Europe: Strong growth led by regulatory compliance needs and a focus on data governance for business intelligence.
- Asia Pacific: Fastest-growing region as digital transformation accelerates in manufacturing, telecom, and consumer sectors; local innovation in SaaS visualization tools is reshaping enterprise data strategies.
- Rest of World: Robust expansion in Middle East, Africa, and Latin America is powered by digitalization of supply chains and mobile commerce.
Product Segmentation
- By Deployment: On-premise, Cloud/Software-as-a-Service (SaaS)
- By End User: BFSI, IT & Telecom, Manufacturing, Healthcare, Retail, Government, Others
- By Solution: Dashboard & Reporting, Analytics & Graphics, Infographics, Custom Visuals, Mobile Visualization
Key Trends
- Shift to cloud-based solutions for scalability, accessibility, and cost-effectiveness.
- Integration of AI and machine learning for automated, adaptive visual insights.
- Mobile and augmented reality visualization enhancing real-time, interactive business analytics.
- Expansion of self-service BI tools empowering non-technical users across departments.
Quote
“Organizations today face unprecedented data complexity, and advanced visualization tools are the bridge transforming raw information into strategic insight. As cloud and AI-driven solutions proliferate, the market is poised for dramatic expansion—delivering clarity, speed, and competitive advantage to enterprises worldwide.”
About Maximize Market Research:
Maximize Market Research is one of the fastest-growing market research and business consulting firms serving clients globally. Our revenue impact and focused growth-driven research initiatives make us a proud partner of majority of the Fortune 500 companies. We have a diversified portfolio and serve a variety of industries such as IT & telecom, chemical, food & beverage, aerospace & defense, healthcare and others.
Contact Us:
MAXIMIZE MARKET RESEARCH PVT. LTD.
2nd Floor, Navale IT park Phase 3,
Pune Banglore Highway, Narhe
Pune, Maharashtra 411041, India.
+91 9607365656