
Data Visualization Tools Market Size & Analysis
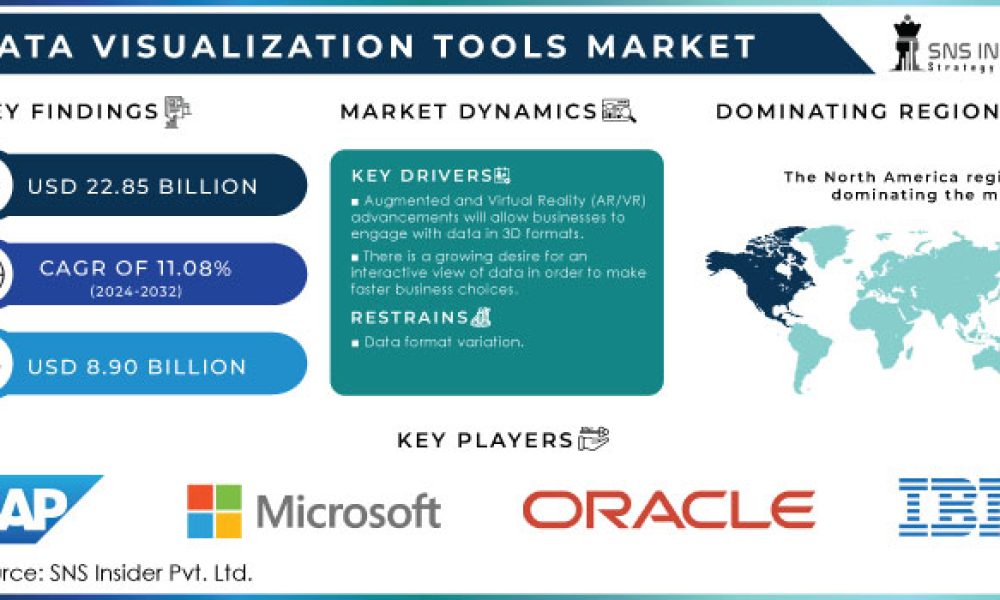
The global Data Visualization Tools Market, valued at USD 8.90 billion in 2023, is projected to skyrocket to USD 22.85 billion by 2032, expanding at a compound annual growth rate (CAGR) of 11.08% from 2024 to 2032. This surge is powered by an escalating need for real-time, data-driven decision-making, the widespread integration of AI and machine learning, and the rapid shift toward cloud-based analytics platforms.
As organizations across sectors wrestle with increasing data complexity, the demand for intuitive, interactive data visualization tools has grown exponentially. These tools convert raw data into visual formats such as charts, graphs, and dashboards, helping businesses uncover patterns, monitor KPIs, and act quickly in competitive markets.
Get Sample Copy of Report: https://www.snsinsider.com/sample-request/2358
Data Visualization Tools Market Fueled by Data-Driven Transformation
The explosive rise in digital transformation initiatives has brought a tsunami of data from IoT devices, cloud platforms, and business applications. In response, companies are increasingly relying on visualization software to extract actionable insights. Verticals like retail, healthcare, finance, and manufacturing are deploying tools like Tableau, Microsoft Power BI, and Qlik Sense to convert structured and unstructured data into compelling visuals that support strategic decision-making.
“Data no longer just supports business operations—it drives them,” said a spokesperson from a leading analytics software firm. “Companies that fail to visualize and operationalize their data will lag behind.”
Cloud adoption is another catalyst. Cloud-based visualization tools offer scalability, flexibility, and lower upfront costs, making them attractive to both large enterprises and small- to medium-sized businesses (SMBs). These platforms are being further strengthened with AI capabilities that automate insight generation, highlight anomalies, and even suggest optimal visual formats based on the data context.
Data Visualization Tools Market Growth Drivers:
Several key factors are accelerating market expansion:
- Advanced Analytics Integration: Predictive analytics and AI-driven tools are elevating visualizations from mere reporting aids to proactive insight engines. Platforms like Power BI and Tableau now offer built-in AI to forecast sales, detect anomalies, and uncover hidden trends.
- Cloud-Based Deployments: With more than 94% of enterprises now leveraging cloud services, the integration of data visualization tools into cloud ecosystems is accelerating. These solutions offer real-time collaboration, faster deployment, and reduced IT overhead.
- Self-Service Analytics: Businesses are embracing tools that empower non-technical users to explore data independently. This democratization of data access fosters faster decision-making and enhances cross-departmental collaboration.
Challenges: Scalability, Compatibility, and Security Concerns
Despite impressive growth, several challenges could temper the market’s momentum. One key issue is scalability. Many legacy or basic visualization tools struggle with large datasets, resulting in performance lags or crashes when processing millions of rows. This forces enterprises to invest in high-performance platforms or hybrid solutions tailored for big data environments.
Another friction point is the complexity of switching platforms. Proprietary file formats and disparate data structures make migration challenging and costly. In addition, cloud-based solutions—while flexible—introduce cybersecurity and data privacy risks. Organizations handling sensitive information in sectors like finance and healthcare must tread carefully, balancing agility with compliance.
Data Visualization Tools Market Segment Insights: Software Dominates, But Services Are Rising Fast
In terms of components, software accounted for over 65.5% of the total revenue in 2023 and is expected to remain dominant. However, the services segment is projected to register the highest CAGR, with enterprises increasingly requiring consulting, integration, and training services to optimize their data stack.
By application, marketing and sales emerged as the largest segment, representing more than 34.5% of the market revenue. Visualization tools help teams map customer journeys, optimize campaigns, and align sales strategies with real-time consumer behavior.
Deployment Models and Enterprise Adoption
The on-premise deployment model led the market in 2023, capturing over 58.7% of global revenue. This model remains the preferred choice for organizations prioritizing data sovereignty and regulatory compliance.
That said, the cloud deployment model is forecast to grow at the fastest pace, thanks to its affordability, scalability, and ease of integration with data lakes and cloud-native BI tools. As companies move toward hybrid analytics infrastructures, cloud-hosted visualization platforms are becoming the norm.
By organization size, large enterprises accounted for 68.5% of market share in 2023, relying heavily on data visualization for strategic planning, risk assessment, and performance monitoring. Yet SMEs are expected to drive future growth, especially as user-friendly, SaaS-based tools level the playing field and lower the barrier to entry.
End-User Industries: IT & Telecom Lead, Healthcare Gaining Speed
The IT and telecom sector captured over 22% of global revenue in 2023, leveraging visualization tools to monitor network health, customer churn, and real-time performance metrics. Meanwhile, healthcare and life sciences are forecast to register the highest CAGR, as providers harness data visualization to streamline operations, track patient outcomes, and drive evidence-based care strategies.
Data Visualization Tools Market Regional Outlook: North America Leads, Asia Pacific Rising Fast
North America continues to be the dominant force in the data visualization tools market, accounting for over 42.5% of global revenue. Mature enterprise ecosystems, strong cloud infrastructure, and widespread use of AI are key enablers. Popular platforms in the region include Power BI, Tableau, D3.js, and Looker.
However, Asia Pacific is poised to grow at the fastest pace, driven by the digitalization of emerging economies and rapid adoption of cloud analytics. Countries like China, India, and Singapore are seeing explosive growth in fintech, e-commerce, and healthcare—industries that rely heavily on data visualization for customer engagement and risk management.
Buy Complete Report: https://www.snsinsider.com/checkout/2358
Data Visualization Tools Market Key Market Players
Leading players shaping the future of data visualization include:
- Microsoft Corporation
- Tableau (Salesforce)
- Oracle
- IBM
- SAS Institute Inc.
- Amazon Web Services, Inc.
- TIBCO Software
- Sisense Inc.
- SAP
- Alibaba Cloud
Recent Developments
- In March 2021, Alteryx partnered with Tech Data to accelerate analytics automation across industries.
- Also in March 2021, Tableau expanded its global reach with the launch of a dedicated UK SaaS region, improving performance and compliance for European customers.
Conclusion: A Visual Future Ahead
As data becomes a business’s most strategic asset, the tools to interpret it visually are becoming indispensable. The global Data Visualization Tools Market is not only growing but transforming—embracing AI, migrating to the cloud, and becoming more accessible to users across roles and departments.
Whether it’s predicting sales, enhancing marketing campaigns, or improving healthcare outcomes, data visualization tools are no longer optional—they’re foundational. As innovation continues, the next decade will likely see these tools move beyond dashboards into immersive, real-time analytics experiences powered by AR, voice interfaces, and conversational AI.
Related Report:
About Us:
SNS Insider is one of the leading market research and consulting agencies that dominates the market research industry globally. Our company’s aim is to give clients the knowledge they require in order to function in changing circumstances. In order to give you current, accurate market data, consumer insights, and opinions so that you can make decisions with confidence, we employ a variety of techniques, including surveys, video talks, and focus groups around the world.
Contact Us:
Jagney Dave – Vice President of Client Engagement
Phone: +1-315 636 4242 (US) | +44- 20 3290 5010 (UK)