Ever feel like the market’s telling you one thing, but your gut whispers something else? Like the price keeps dipping lower, but something just doesn’t feel right about the downward momentum? That nagging suspicion might just be your inner trader picking up on a Bullish Divergence – one of the most powerful, yet often misunderstood, signals in a technical analyst’s toolbox. Think of it as the market’s secret handshake, hinting that a downtrend is running out of steam before the price actually turns around. Ready to learn this secret language? Let me walk you through it.
So, What Exactly is Bullish Divergence?
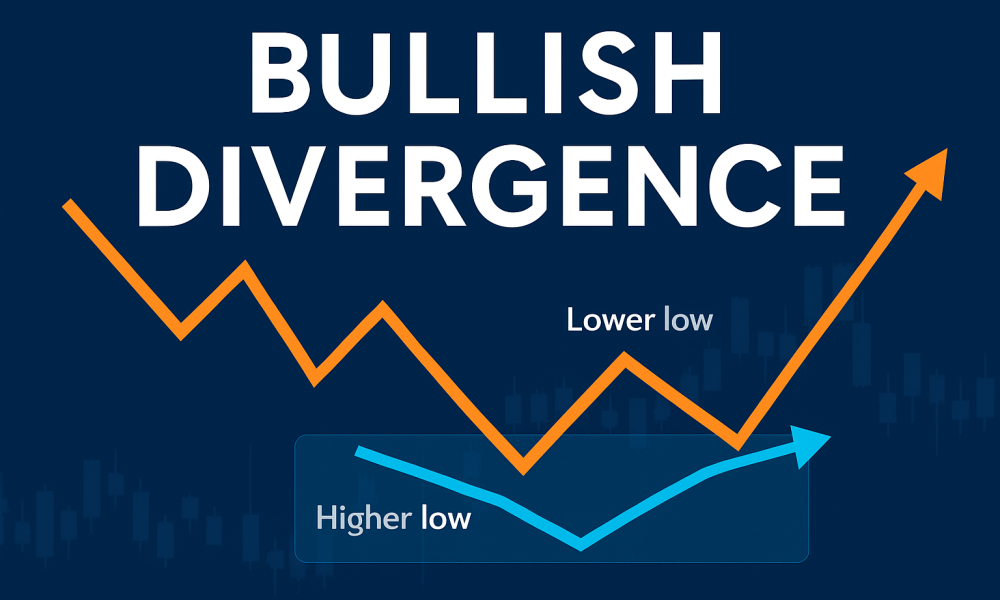
In its simplest form, Bullish Divergence is a disagreement, a conflict, a classic case of “what you see isn’t the whole story.” It happens when the price of an asset (like a stock, crypto, or forex pair) is making lower lows – meaning each drop bottoms out at a lower point than the one before. That screams downtrend, right? Normally, yes.
But here’s the twist: simultaneously, a key momentum indicator (like the Relative Strength Index – RSI, Moving Average Convergence Divergence – MACD, Stochastic Oscillator, or even the Money Flow Index – MFI) starts doing the opposite. Instead of confirming the price’s weakness by also making lower lows, this indicator starts making higher lows.
Picture it like this: You’re watching a car race downhill (the price). It keeps hitting lower points on the track (lower lows). But when you glance at the tachometer (the momentum indicator), the engine revs (momentum) aren’t increasing with each steeper drop; in fact, they’re actually rising less or even starting to increase slightly. That tells you the driver might be easing off the gas or even tapping the brakes, even though the car is still going downhill! The downward momentum is weakening, hinting the descent might soon end or even reverse. That is the core magic of Bullish Divergence.
Why Should You Care About This Disagreement?
Because it’s often an early warning signal! While the price action looks purely bearish (downward), the improving momentum underneath the surface suggests that selling pressure is drying up. The bears (sellers) are losing their grip, even if they haven’t fully let go yet. The bulls (buyers) are starting to step in more aggressively at these lower levels, preventing the momentum indicator from sinking further. This hidden strength frequently precedes a pause in the downtrend, a potential reversal, or at the very least, a decent bounce.
The Mechanics: How Bullish Divergence Works Under the Hood
Okay, let’s get slightly more technical (but I promise to keep it clear!). Momentum indicators are typically calculated based on price changes over a specific period. They measure the speed and force behind price movements.
- Lower Lows in Price: This visually represents the ongoing downtrend. Each new low confirms the bearish sentiment – sellers are still in control, pushing prices down.
- Higher Lows in the Indicator: This is the critical clue. When the indicator forms a higher low while the price makes a lower low, it signals that the velocity of the downtrend is slowing down. The force behind each successive downward push is diminishing. Imagine pushing a boulder downhill; the first push sends it flying, the second push moves it less, and the third push barely budges it – even though it’s still rolling down. The energy (momentum) is fading.
This divergence between weakening momentum (indicator improving) and continued price decline creates tension. It suggests that despite the price hitting new lows, the conviction behind the selling is waning. Buyers are becoming more active, absorbing the selling pressure more effectively at each lower level. It’s a classic setup for mean reversion or trend reversal.
Spotting the Signal: Identifying Bullish Divergence Like a Pro
Knowing the theory is one thing; seeing it on a chart is another. Here’s your practical guide:
- Confirm the Downtrend: First things first. You need a clear, established sequence of lower highs and lower lows in the price. No downtrend? Then divergence signals lose much of their meaning. Look for the overall price direction pointing southeast.
- Choose Your Weapon (Indicator): Pick one or two reliable momentum oscillators. RSI (14-period is common) and MACD are the most popular for spotting divergence due to their sensitivity to momentum shifts. Add them to your price chart.
- Find the Price Lows: Identify at least two distinct, significant swing lows in the price within the downtrend. Label them Low 1 and Low 2. Crucially, Low 2 must be LOWER than Low 1.
- Find the Corresponding Indicator Lows: Now, look at your chosen indicator (RSI, MACD histogram, MACD line, or Stochastic) at the exact same time as those price lows. What is the indicator reading at Low 1? What is it at Low 2?
- Look for the Disagreement (The Divergence!): This is the moment of truth. If the indicator reading at Low 2 is HIGHER than the reading at Low 1, while the price at Low 2 is LOWER than at Low 1… Bingo! You’ve spotted Bullish Divergence.
Putting Bullish Divergence to Work: Trading Strategies
Spotting it is great, but how do you actually use it? Remember, it’s a signal, not a crystal ball. Here’s how savvy traders incorporate it:
- Confirmation is King: Never trade solely on divergence. It’s best used as a warning to look for other confirming signals before entering a trade. What might these be?
- Price Pattern Break: A break above a minor downsloping trendline connecting the recent lower highs.
- Candlestick Reversal: A bullish candlestick pattern (like a hammer, bullish engulfing, or morning star) forming at or near the second low (Low 2).
- Support Level Bounce: The second low occurring at a known historical support level or a key moving average.
- Indicator Crossovers: For example, the MACD line crossing above its signal line shortly after the divergence forms, or RSI breaking above 30 (if it was oversold).
Entry Point: A common strategy is to enter a long position (buy) after price breaks above the swing high that formed between the two lows (Low 1 and Low 2). This confirms buyers have overcome the immediate resistance. Alternatively, a break above a short-term down trendline drawn on the price can be an entry trigger. Some aggressive traders might enter near the formation of the second low, using a tight stop loss, but this carries higher risk.
Stop Loss Placement: This is non-negotiable for risk management. Your stop loss should typically be placed below the most recent swing low (Low 2). If price takes out that low, the divergence signal has likely failed. The size of your stop will depend on your risk tolerance and the asset’s volatility.
Profit Targets: Divergence signals potential reversal or bounce, but not the magnitude.
Use logical targets:
- Previous resistance levels.
- Key moving averages (e.g., 50-day or 200-day).
- Measured moves based on the size of the preceding downtrend or consolidation patterns.
- Trailing stops to capture extended moves while locking in profits.
The Flip Side: Limitations and Risks of Bullish Divergence
Look, no indicator is perfect, and Bullish Divergence is no exception. Treating it like a holy grail is a fast track to losses. Be aware of:
- False Signals: Divergence can form, and the price can just keep going down! This often happens in very strong, sustained bearish trends fueled by significant negative news or sentiment. The divergence signals a pause, not necessarily a full reversal.
- Timing is Imprecise: It tells you momentum is weakening, not exactly when the price will turn. The reversal could happen immediately, or it could take days, weeks, or even longer. Patience is required.
- Not a Standalone Tool: We hammered this before, but it’s vital. Divergence gains its power when combined with other technical analysis techniques (support/resistance, trendlines, volume, candlesticks) and sound risk management. It’s one piece of the puzzle.
- Context Matters: Divergence within a strong, established downtrend is generally more reliable than divergence during choppy, sideways action. Also, divergence signals on higher timeframes (daily, weekly) tend to be stronger and more significant than those on lower timeframes (like 5-minute or 1-hour charts).
Conclusion
Bullish Divergence is like learning to understand the market’s subtle whispers amidst all the shouting. It’s that powerful hint of underlying strength when everything on the surface looks bleak. By identifying this disagreement between price action and momentum, you gain a potential edge – an early warning that a downtrend might be exhausting itself.
Mastering its identification on key indicators like RSI and MACD, crucially combining it with other confirming signals and rigorous risk management (always use that stop loss!), allows you to spot high-probability reversal or bounce opportunities before the crowd catches on. It transforms you from simply reacting to price moves to anticipating potential shifts in market sentiment.
Remember, it’s not a magic trick guaranteeing profits every time. There will be false signals and frustrating delays. But consistently applied within a robust trading framework, understanding and utilizing Bullish Divergence becomes an invaluable skill, helping you navigate the markets with greater insight and confidence. So, next time you see price making lower lows, don’t just despair – check the momentum. The hidden strength revealed by divergence might just be your signal to get ready. Happy trading!